NaN
/
of
-Infinity
Low Pressure UV Lab Chamber Oven
Low Pressure UV Lab Chamber Oven
No reviews
SKU:301044-A
Couldn't load pickup availability
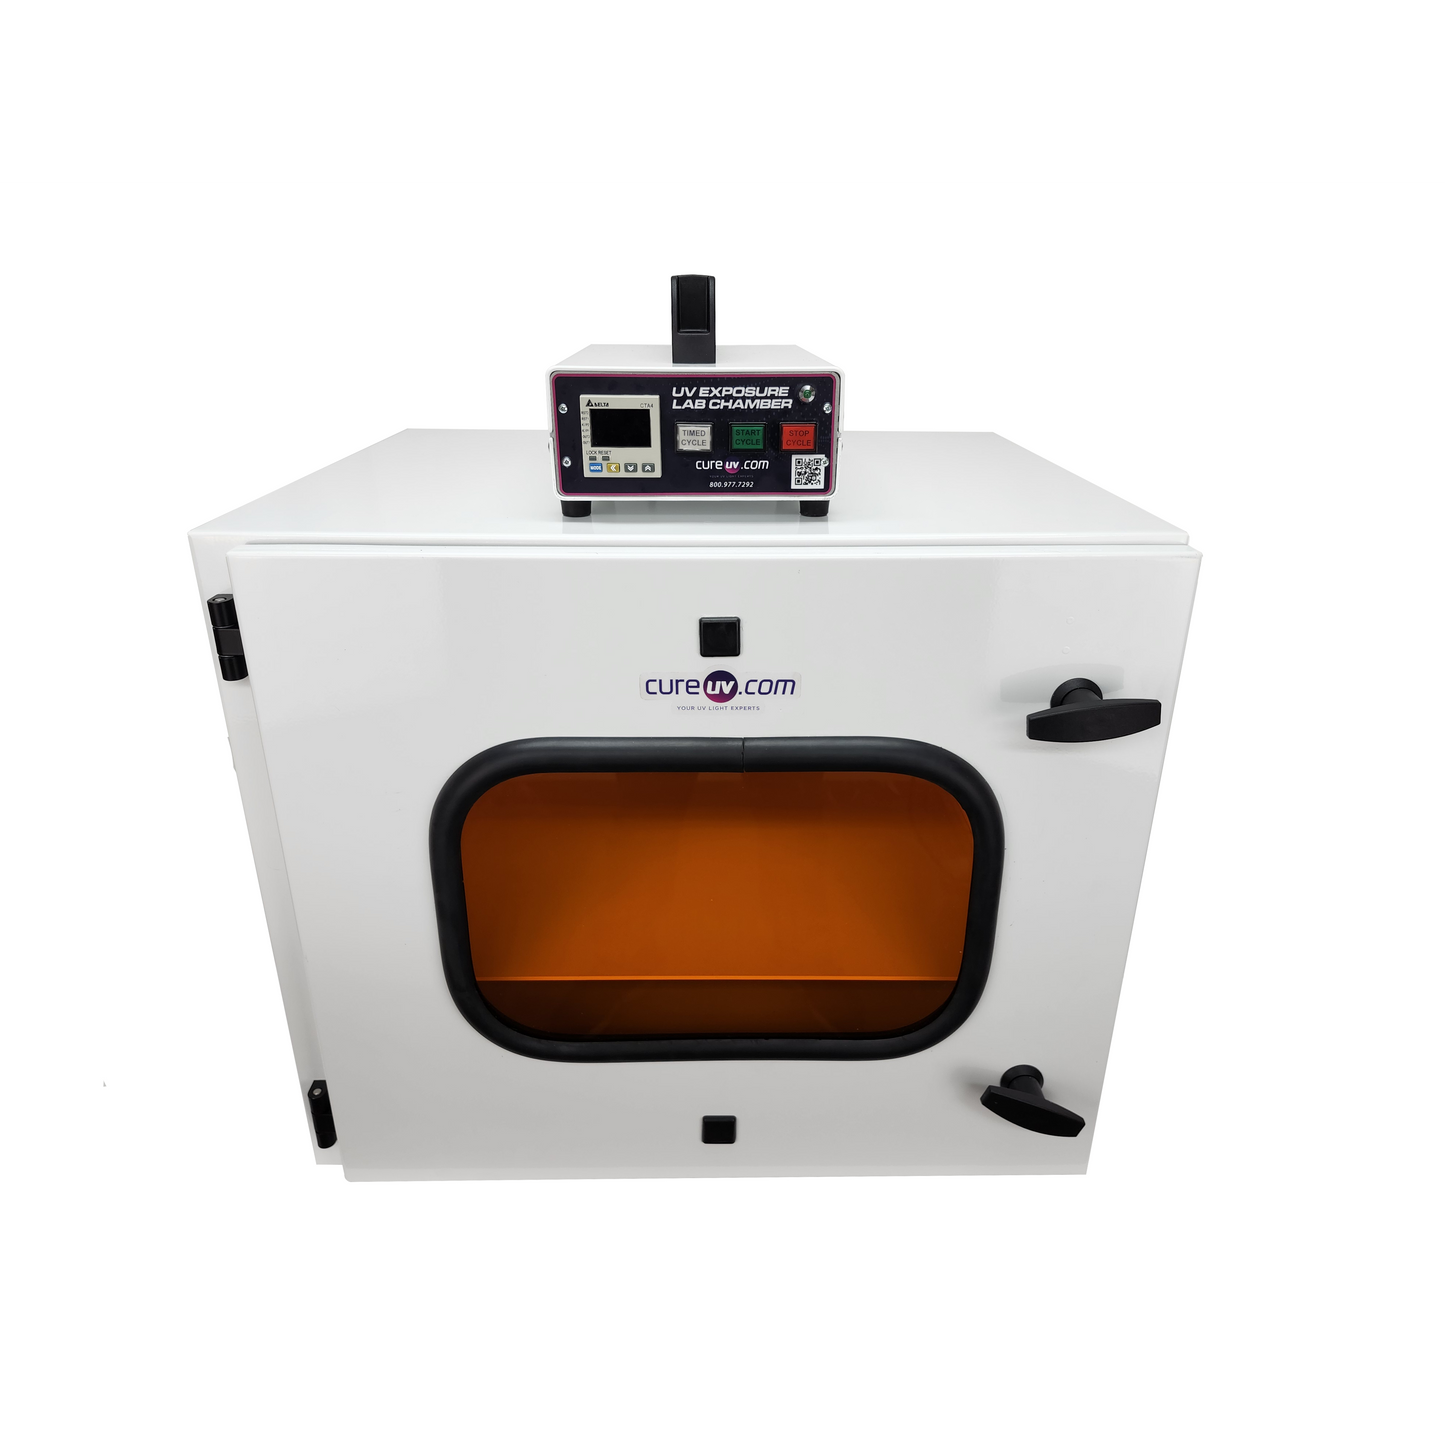
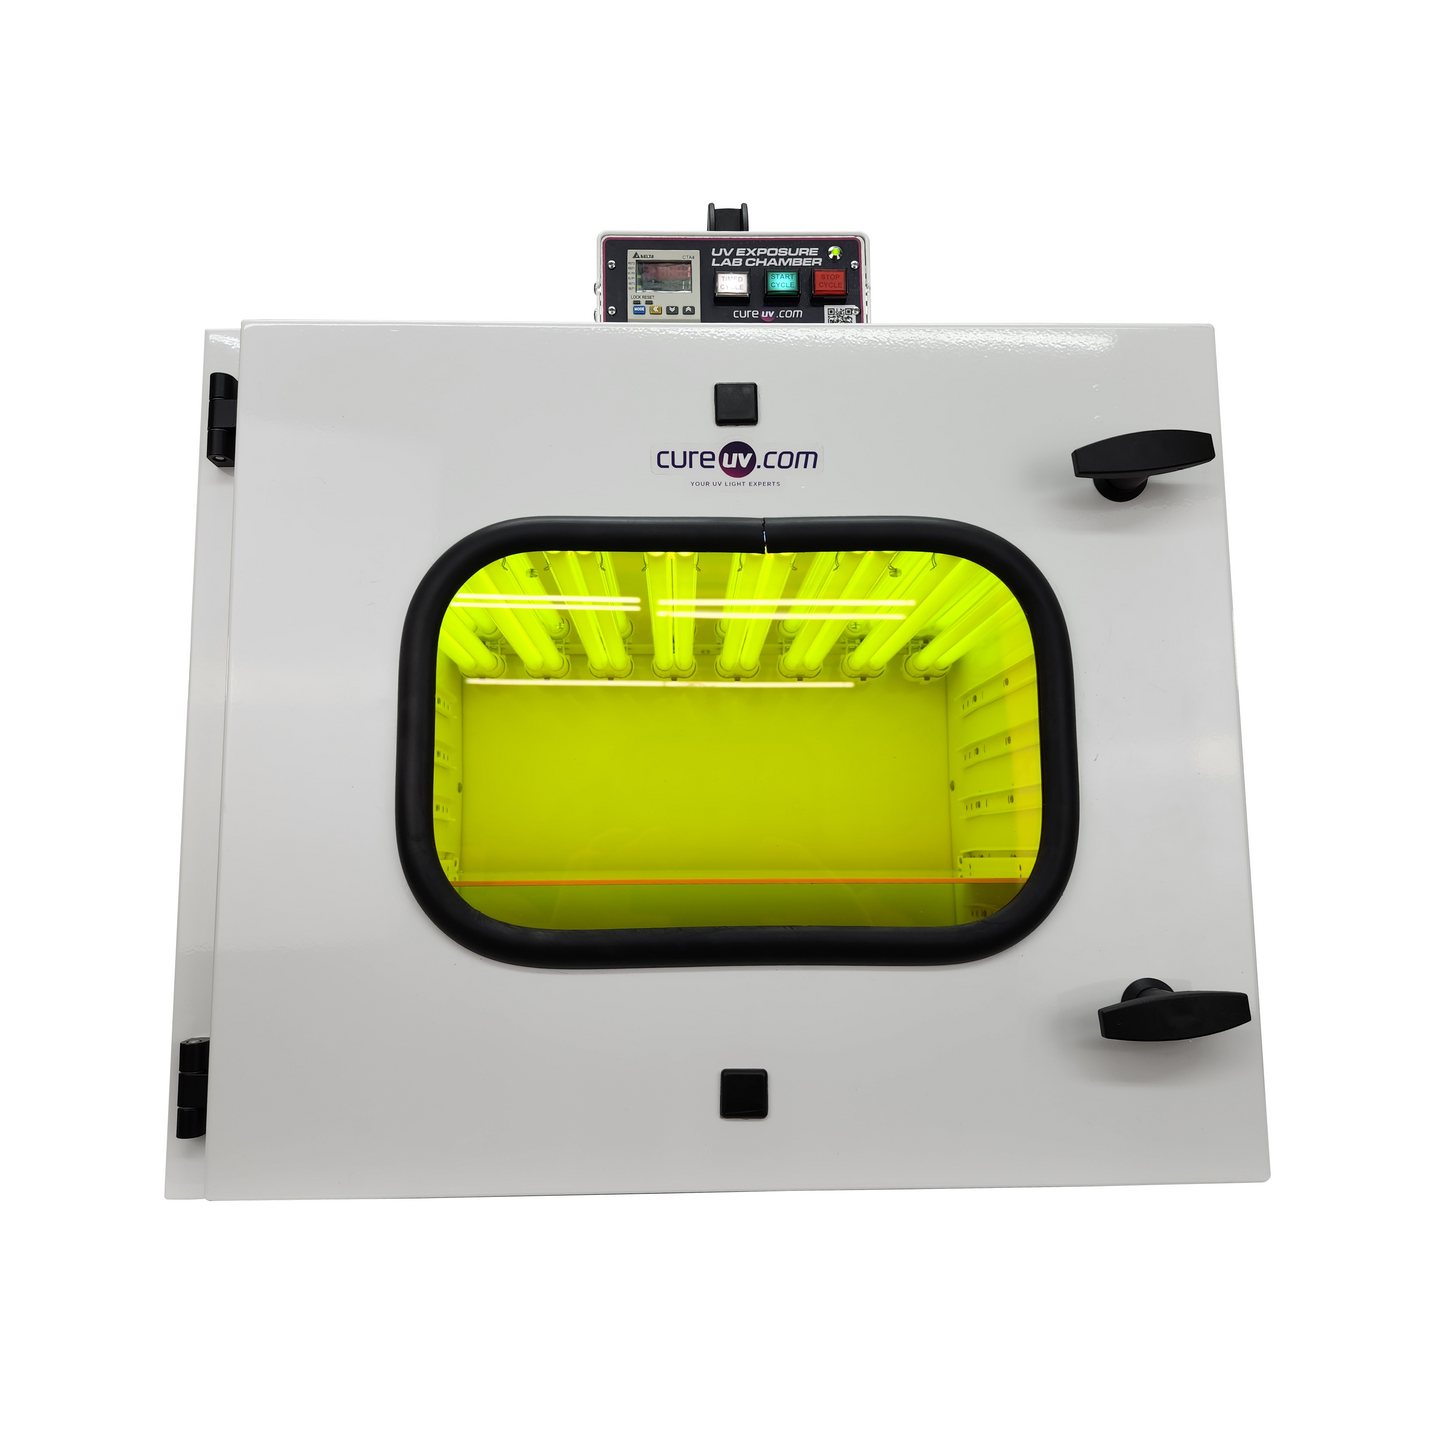
UV-A, UV-B, or UV-C Light Oven with adjustable shelf height and uniform coverage
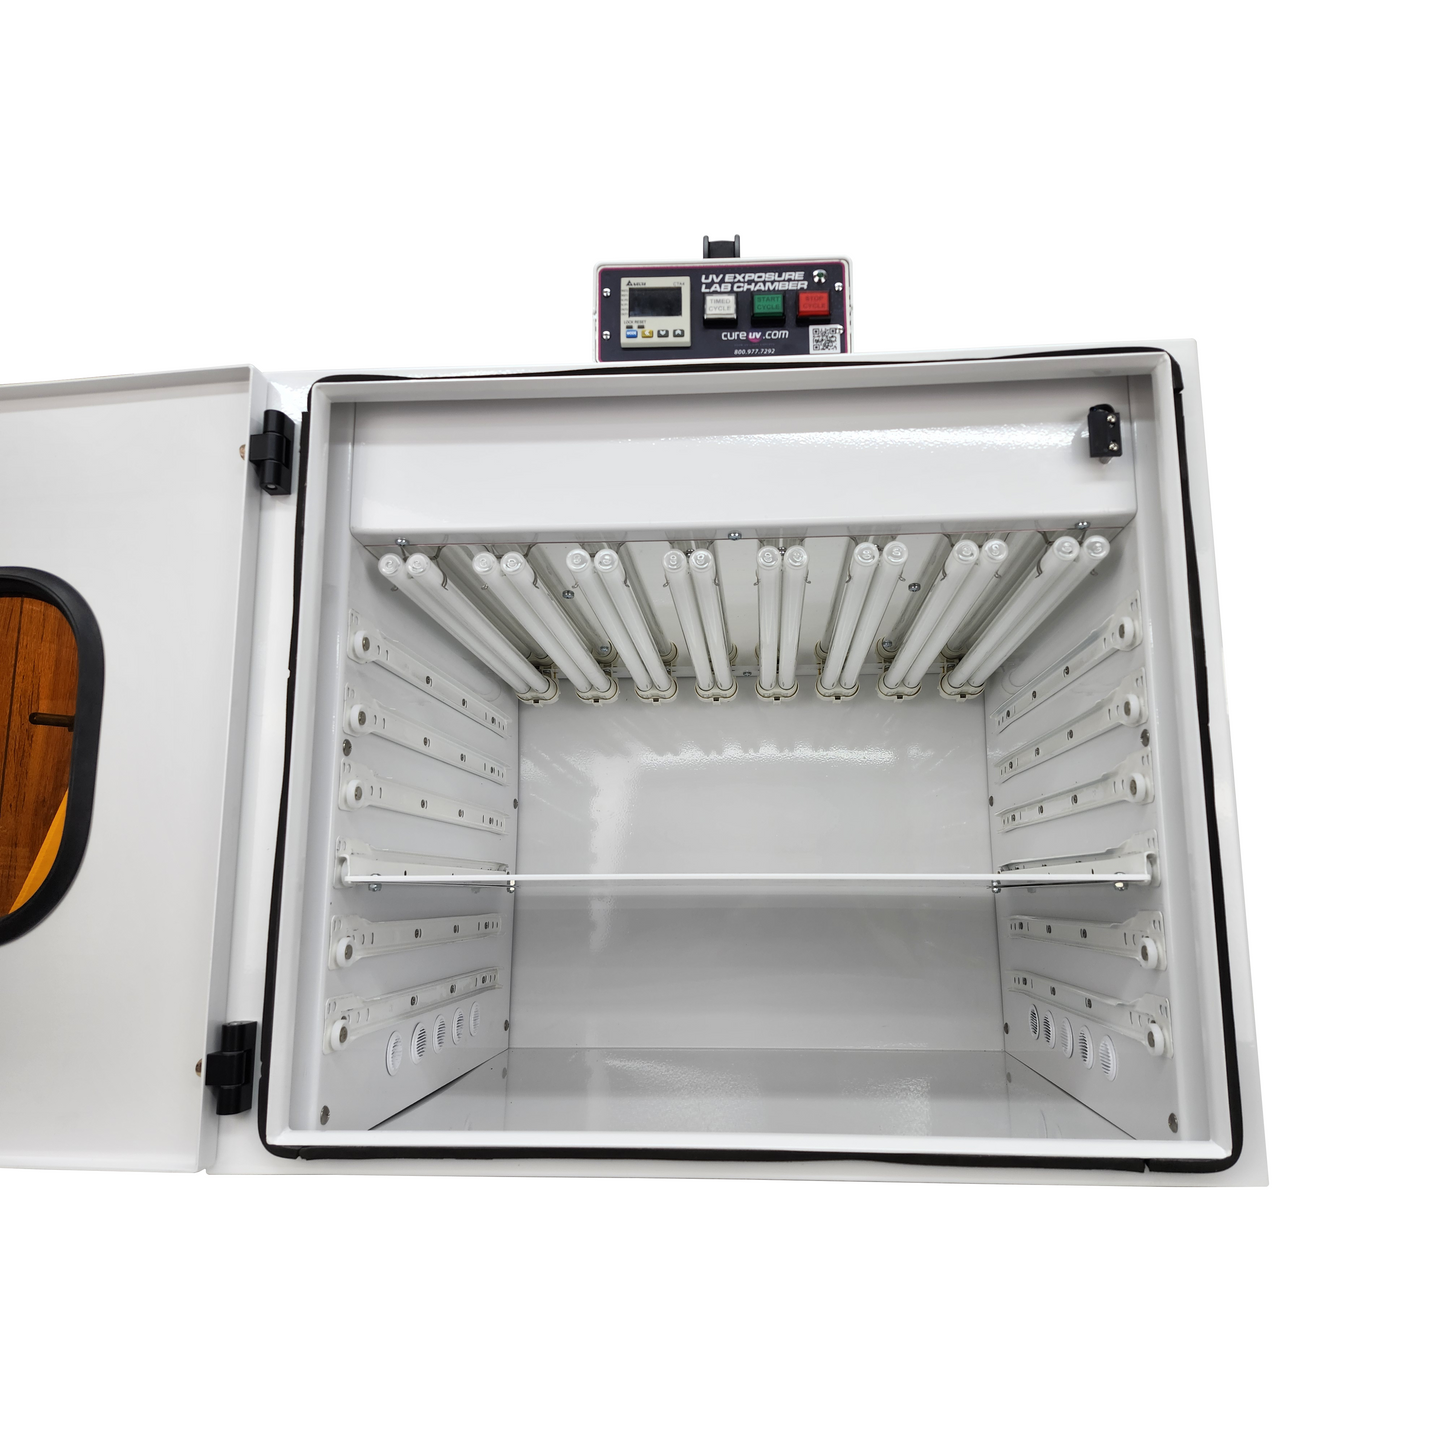
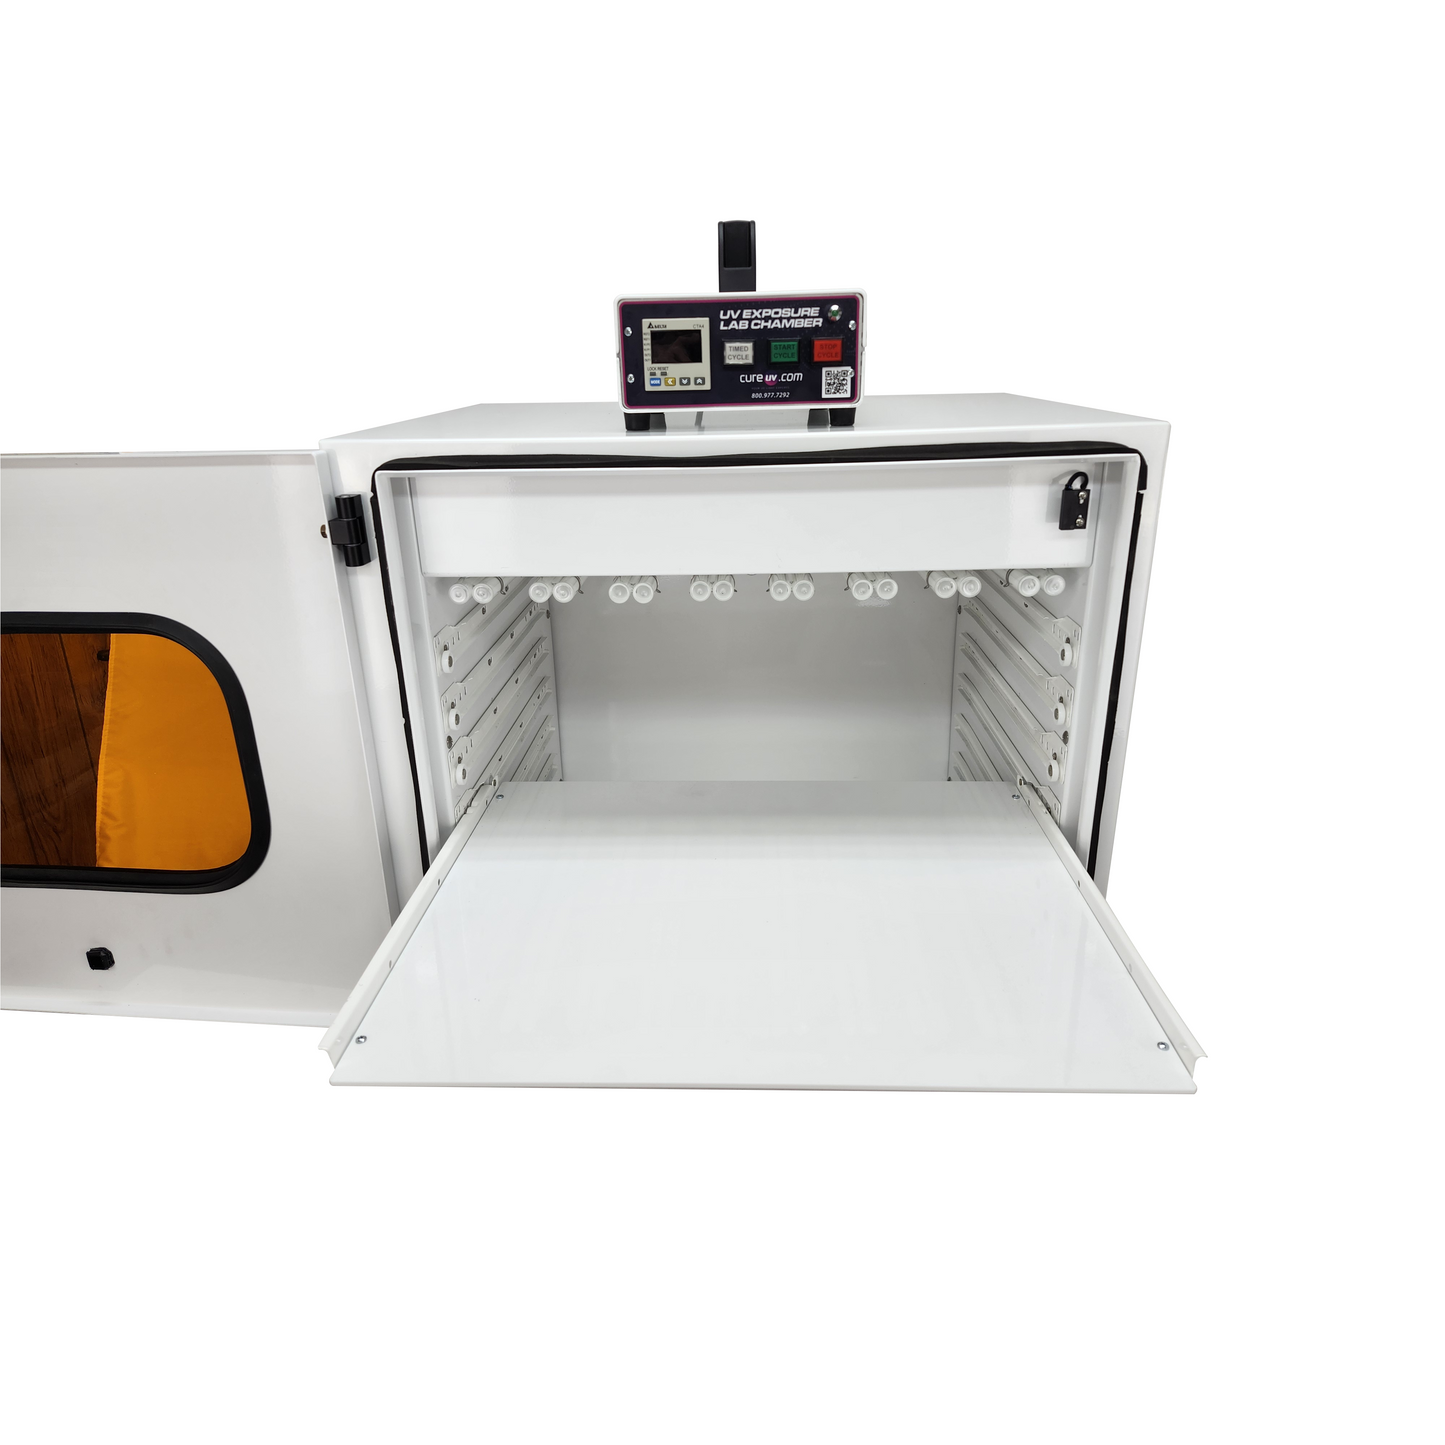
SPDIUV's variable intensity UV curing lab chamber provides you with uniform ultraviolet light exposure throughout the entire 16.5" x 20" adjustable shelf.
Features:
- User-friendly standalone UV lab testing enclosure with adjustable 16.5" by 20" specimen shelf (3" to 10" range of adjustment from specimen shelf distance to lamp output) to provide intensity variation
- The standard in UV Emitting Dosage Control: option of low pressure UVA, UVB and UVC lamps
- System status indicator lamps with ready signal & safety interlock
- Includes Electronically Brightened UV Reflector designed to provide 98% reflectivity, ensuring maximum UV energy delivery
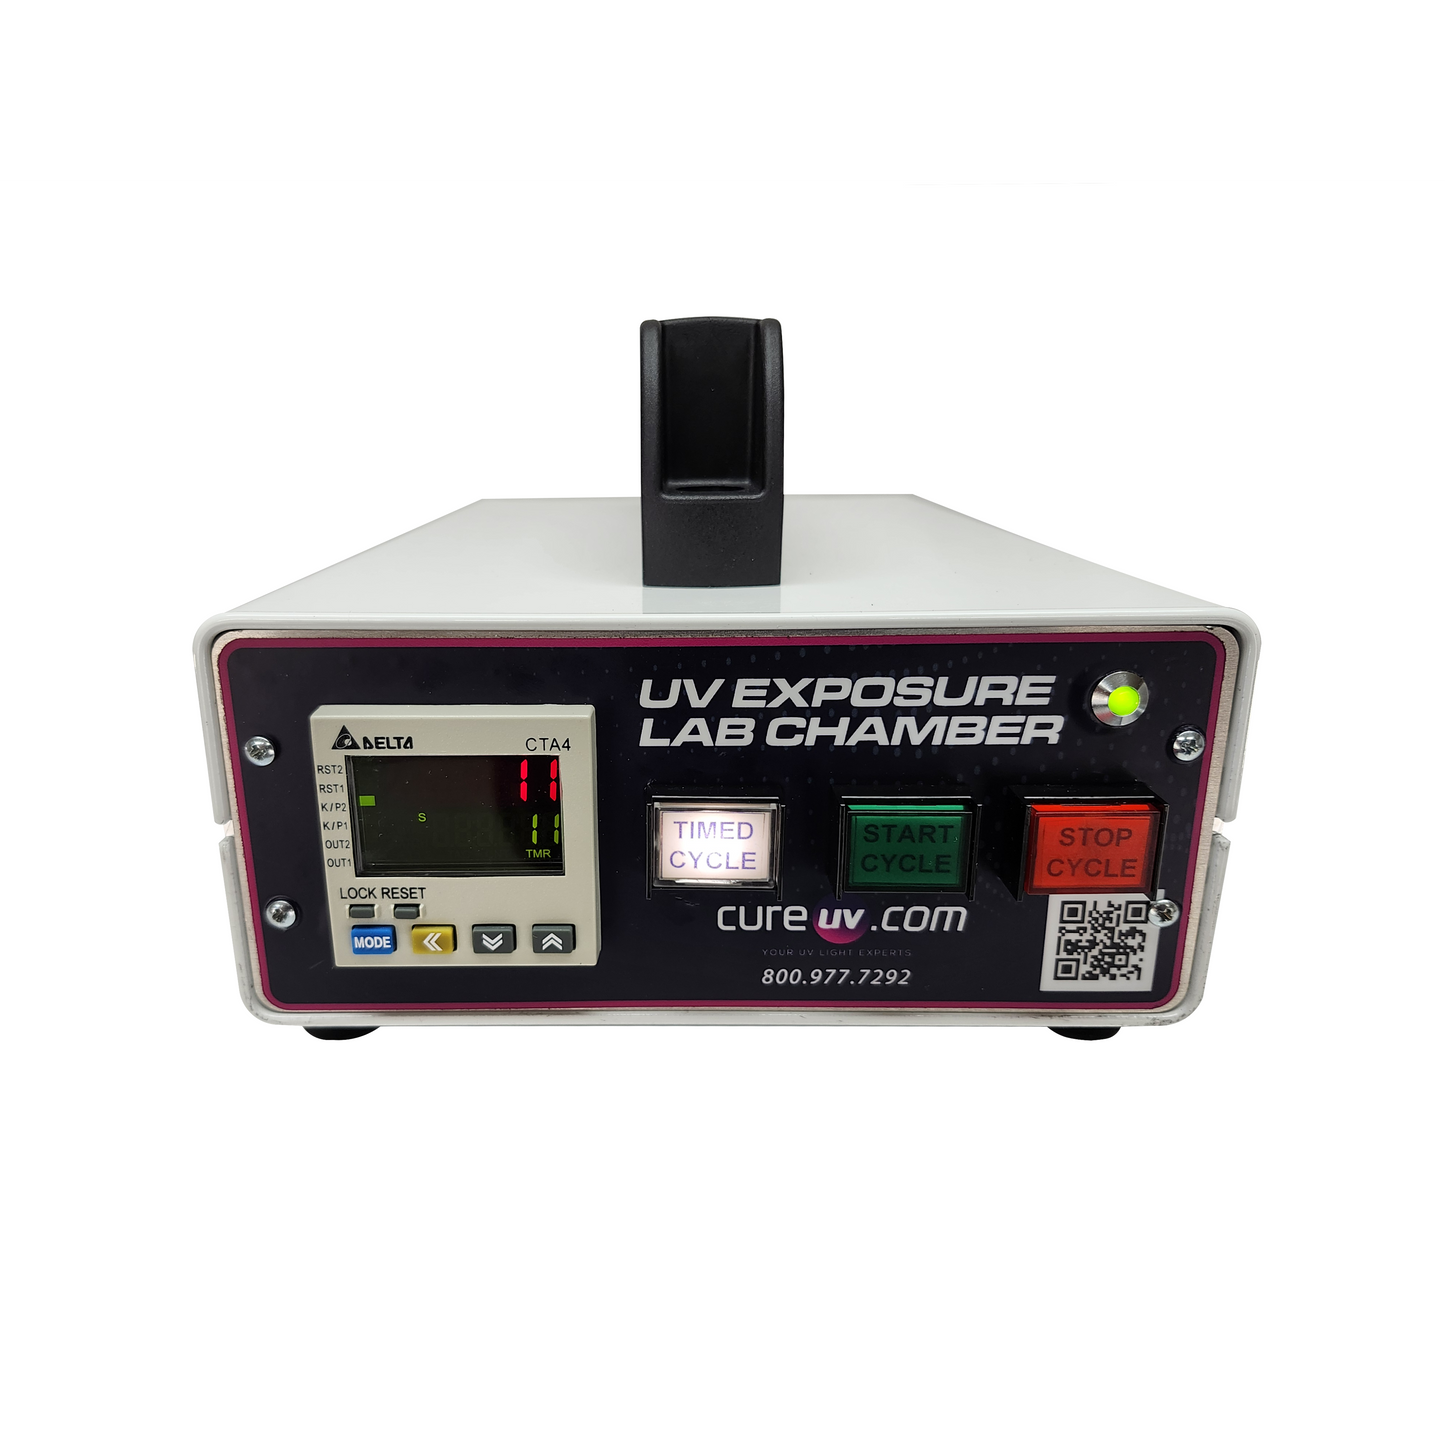
- Programmable Start Timer with Auto Shut off feature for cycle repeatability.
- Programmable UV Dosage Control: On/Off timer is indicated in minutes and seconds
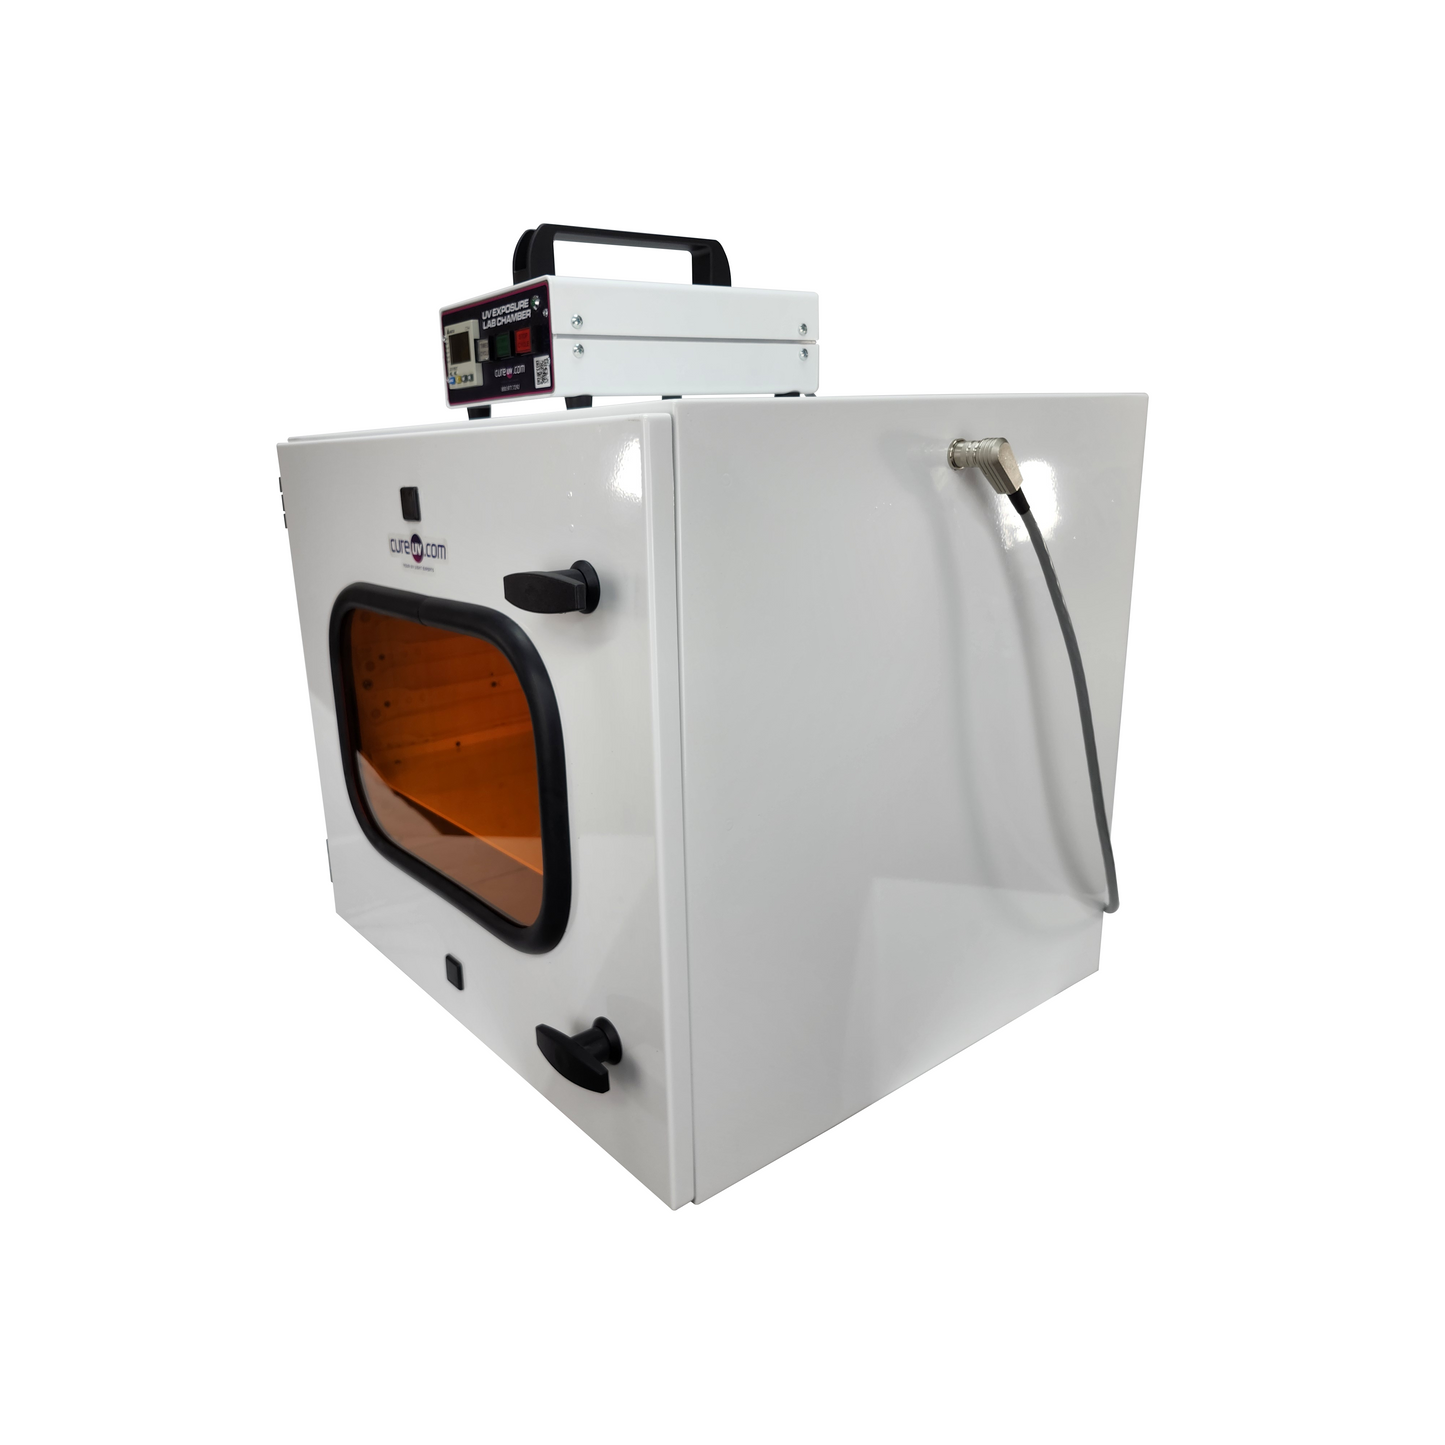
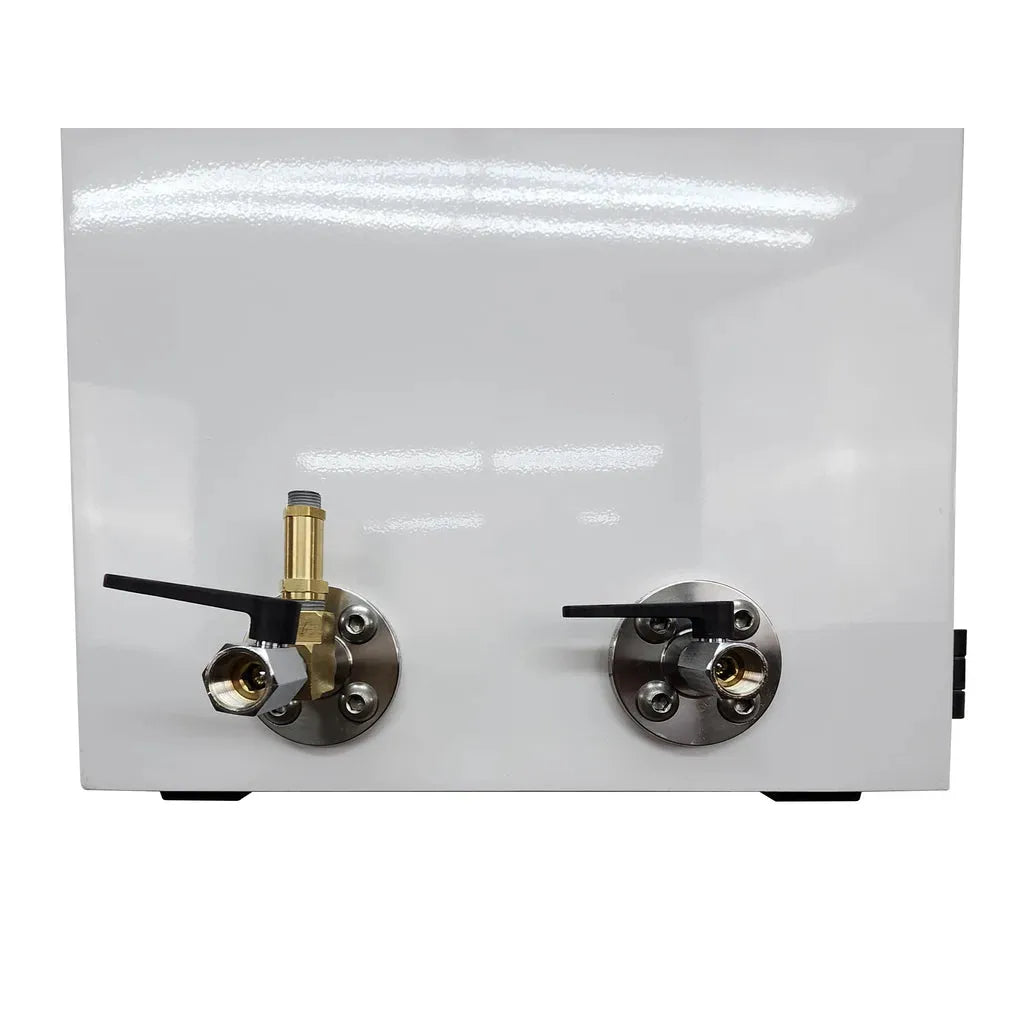
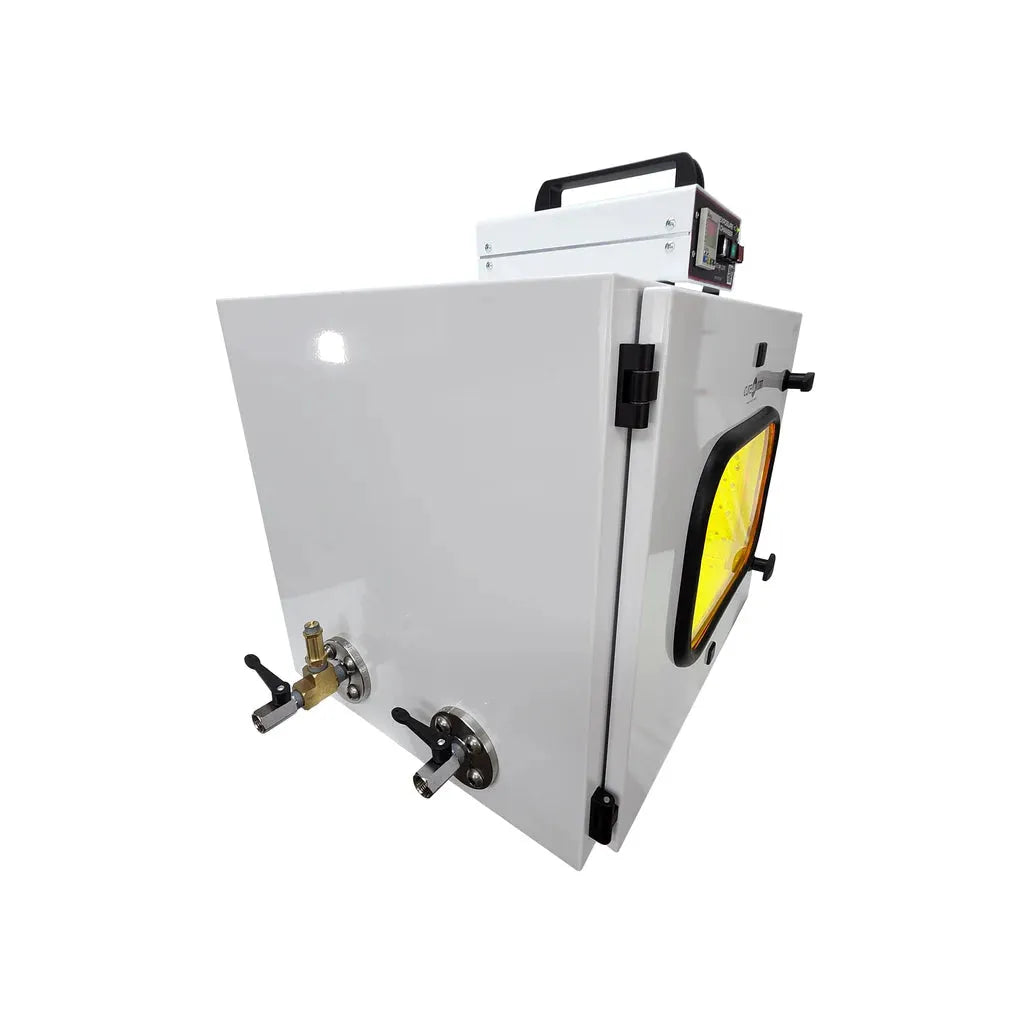
- Nitrogen Purge option seals the enclosure and adds 1/4 NPT filling, removing speed valves so that the unit can be hooked up to your lab's nitrogen lines
- Nitrogen Purge ensures all photoreactions occur in a nearly inert environment using nitrogen purging
- Forward and Rear Doors equipped with UV-filtered viewing glass for safe subject/cycle observation
- Uses standard 110 volt power input
- Made in the USA

Any questions about his item, please feel free to call us at 1(800) 977-7292 or email us at sales@cureuv.com!
Specifications:
- UV Coverage Area: 15" x 19"
- Dosage Range: 0 to 100 J/cm² over 60 minutes
- Specimen Distance from Light Source: Adjustable from 3 to 10 inches
- Input Power Requirements: 110V-60Hz or 220V-50Hz
- Output Lamp Choices: Each chamber comes with a set of bulbs of your choice included. However, if you would like to purchase additional sets, you are able to at the links below:
-
- UVA: 320-400nm - Set of 8 UV-A Bulbs
- UVB: 290-320nm - Set of 8 UV-B Bulbs
- UVC: 100-290nm - Set of 8 UV-C Bulbs
Warning: Ultraviolet UV-A, UV-B and UV-C light is harmful to your eyes and skin. Use proper safety gear.
Also Known As:
Also Known As:
Share
Technical Data for Low Pressure UV Lab Chamber Oven
INTENSITY CHART
| Tray Position |
UV-A |
UV-B | UV-C |
| 1 | 7.95 mW/cm2 | 5.93 mW/cm2 | 9.94 mW/cm2 |
| 2 | 10.03 mW/cm2 | 7.31 mW/cm2 | 12.39 mW/cm2 |
| 3 | 12.44 mW/cm2 | 9.01 mW/cm2 | 15.63 mW/cm2 |
| 4 | 14.91 mW/cm2 | 10.86 mW/cm2 | 18.87 mW/cm2 |
| 5 | 16.87 mW/cm2 | 12.24 mW/cm2 | 21.48 mW/cm2 |
| 6 | 18.74 mW/cm2 | 13.98 mW/cm2 | 26.15 mW/cm2 |
- Positions on the chart correspond to the tray sloths on the interior of the oven. 1 being the furthest away from the emitting bulb (on the top side of the oven) and 6 being the nearest.


